Typical server utilization is between 10% and 50%. Google has demonstrated 90% utilization without impacting latency SLAs. Xkcd estimated that Google owns 2 million machines. If you estimate an amortized total cost of $4k per machine per year, that's $8 billion per year. With numbers like that, even small improvements have a large impact, and this isn't a small improvement.
How is it possible to get 2x to 9x better utilization on the same hardware? The low end of those typical utilization numbers comes from having a service with variable demand and fixed machine allocations. Say you have 100 machines dedicated to Jenkins. Those machines might be very busy when devs are active, but they might also have 2% utilization at 3am. Dynamic allocation (switching the machines to other work when they're not needed) can get a typical latency-sensitive service up to somewhere in the 30%-70% range. To do better than that across a wide variety of latency-sensitive workloads with tight SLAs, we need some way to schedule low priority work on the same machines, without affecting the latency of the high priority work.
It's not obvious that this is possible. If both high and low priority workloads need to monopolize some shared resources like the last-level cache (LLC), memory bandwidth, disk bandwidth, or network bandwidth, there we're out of luck. With the exception of some specialized services, it's rare to max out disk or network. But what about caches and memory? It turns out that Ferdman et al. looked at this back in 2012 and found that typical server workloads don't benefit from having more than 4MB - 6MB of LLC, despite modern server chips having much larger caches.
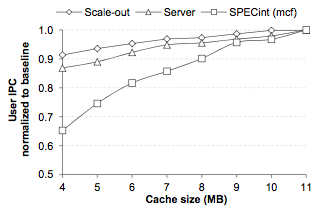
For this graph, scale-out workloads are things like distributed key-value stores, MapReduce-like computations, web search, web serving, etc. SPECint(mcf) is a traditional workstation benchmark. “server” is old school server benchmarks like SPECweb and TPC . We can see that going from 4MB to 11MB of LLC has a small effect on typical datacenter workloads, but a significant effect on this traditional workstation benchmark.
Datacenter workloads operate on such large data sets that it's often impossible to fit the dataset in RAM on a single machine, let alone in cache, making a larger LLC not particularly useful. This was result was confirmed by Kanev et al.'s ISCA 2015 paper where they looked at workloads at Google. They also showed that memory bandwidth utilization is, on average, quite low.
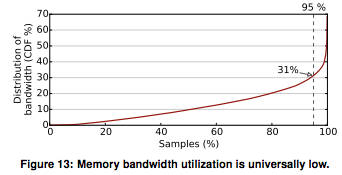
You might think that the low bandwidth utilization is because the workloads are compute bound and don't have many memory accesses. However, when the authors looked at what the cores were doing, they found that a lot of time was spent stalled, waiting for cache/memory.
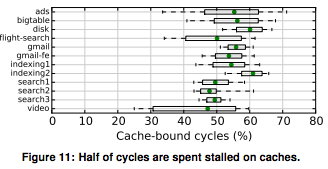
Each row is a Google workload. When running these typical workloads, cores spend somewhere between 46% and 61% of their time blocked on cache/memory. It's curious that we have low cache hit rates, a lot of time stalled on cache/memory, and low bandwidth utilization. This is suggestive of workloads spending a lot of time waiting on memory accesses that have some kind of dependencies that prevent them from being executed independently.
LLCs for high-end server chips are between 12MB and 30MB, even though we only need 4MB to get 90% of the performance, and the 90%-ile utilization of bandwidth is 31%. This seems like a waste of resources. We have a lot of resources sitting idle, or not being used effectively. The good news is that, since we get such low utilization out of the shared resources on our chips, we should be able to schedule multiple tasks on one machine without degrading performance.
Great! What happens when we schedule multiple tasks on one machine? The Lo et al. Heracles paper at ISCA this year explores this in great detail. The goal of Heracles is to get better utilization on machines by co-locating multiple tasks on the same machine.
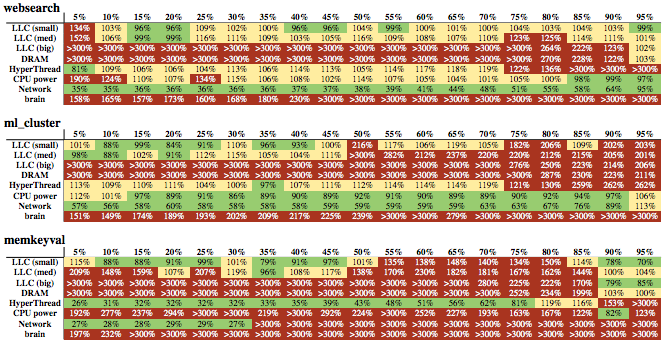
The figure above shows three latency sensitive (LC) workloads with strict SLAs. websearch is the query serving service in Google search, ml_cluster is real-time text clustering, and memkeyval is a key-value store analogous to memcached. The values are latencies as a percent of maximum allowed by the SLA. The columns indicate the load on the service, and the rows indicate different types of interference. LLC, DRAM, and Network are exactly what they sound like; custom tasks designed to compete only for that resource. HyperThread means that the interfering task is a spinloop running in the other hyperthread on the same core (running in the same hyperthread isn't even considered since OS context switches are too expensive). CPU power is a task that's designed to use a lot of power and induce thermal throttling. Brain is deep learning. All of the interference tasks are run in a container with low priority.
There's a lot going on in this figure, but we can immediately see that the best effort (BE) task we'd like to schedule can't co-exist with any of the LC tasks when only container priorities are used -- all of the brain rows are red, and even at low utilization (the leftmost columns), latency is way above 100% of the SLA latency.. It's also clear that the different LC tasks have different profiles and can handle different types of interference. For example, websearch and ml_cluster are neither network nor compute intensive, so they can handle network and power interference well. However, since memkeyval is both network and compute intensive, it can't handle either network or power interference. The paper goes into a lot more detail about what you can infer from the details of the table. I find this to be one of the most interesting parts of the paper; I'm going to skip over it, but I recommend reading the paper if you're interested in this kind of thing.
A simplifying assumption the authors make is that these types of interference are basically independent. This means that independent mechanisms that isolate LC task from “too much” of each individual type of resource should be sufficient to prevent overall interference. That is, we can set some cap for each type of resource usage, and just stay below each cap. However, this assumption isn't exactly true -- for example, the authors show this figure that relates the LLC cache size to the number cores allocated to an LC task.
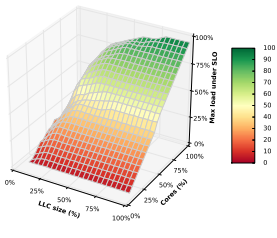
The vertical axis is the max load the LC task can handle before violating its SLA when allocated some specific LLC and number of cores. We can see that it's possible to trade off cache vs cores, which means that we can actually go above a resource cap in one dimension and maintain our SLA by using less of another resource. In the general case, we might also be able to trade off other resources. However, the assumption that we can deal with each resource independently reduces a complex optimization problem to something that's relatively straightforward.
Now, let's look at each type of shared resource interference and how Heracles allocates resources to prevent SLA-violating interference.
Core
Pinning the LC and BE tasks to different cores is sufficient to prevent same-core context switching interference and hyperthreading interference. For this, Heracles used cpuset. Cpuset allows you to limit a process (and its children) to only run on a limited set of CPUs.
Network
On the local machines, Heracles used qdisc to enforce quotas. For more on cpuset, qdisc, and other quota/partitioning mechanisms this LWN series on cgroups by Neil Brown is a good place to start. Cgroups are used by a lot of widely used software now (Docker, Kubernetes, Mesos, etc.); they're probably worth learning about even if you don't care about this particular application.
Power
Heracles uses Intel's running average power limit to estimate power. This is a feature on Sandy Bridge (2009) and newer processors that uses some on-chip monitoring hardware to estimate power usage fairly precisely. Per-core dynamic voltage and frequency scaling is used to limit power usage by specific cores to keep them from going over budget.
Cache
The previous isolation mechanisms have been around for a while, but this is one is new to Broadwell chips (released in 2015). The problem here is that if the BE task needs 1MB of LLC and the LC task needs 4MB of LLC, a single large allocation from the BE task will scribble all over the LLC, which is shared, wiping out the 4MB of cached data the LC needs.
Intel's “Cache Allocation Technology” (CAT) allows the LLC to limit which cores can can access different parts of the cache. Since we often want to pin performance sensitive tasks to cores anyway, this allows us to divide up the cache on a per-task basis.
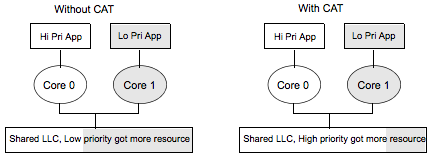
Intel's April 2015 whitepaper on what they call Cache Allocation Technology (CAT) has some simple benchmarks comparing CAT vs. no-CAT. In this example, they measure the latency to respond to PCIe interrupts while another application has heavy CPU-to-memory traffic, with CAT on and off.
| Condition | Min | Max | Avg |
| no CAT | 1.66 | 30.91 | 4.53 |
| CAT | 1.22 | 20.98 | 1.62 |
With CAT, average latency is 36% of latency without CAT. Tail latency doesn't improve as much, but there's also a substantial improvement there. That's interesting, but to me the more interesting question is how effective this is on real workloads, which we'll see when we put all of these mechanisms together.
Another use of CAT that I'm not going to discuss at all is to prevent timing attacks, like this attack, which can recover RSA keys across VMs via LLC interference.
DRAM bandwidth
Broadwell and newer Intel chips have memory bandwidth monitoring, but no control mechanism. To work around this, Heracles drops the number of cores allocated to the BE task if it's interfering with the LC task by using too much bandwidth. The coarse grained monitoring and control for this is inefficient in a number of ways that are detailed in the paper, but this still works despite the inefficiencies. However, having per-core bandwidth limiting would give better results with less effort.
Putting it all together
This graph shows the effective utilization of LC websearch with other BE tasks scheduled with enough slack that the SLA for websearch isn't violated.
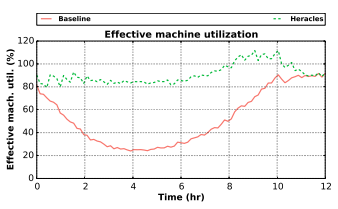
From barroom conversations with folks at other companies, the baseline (in red) here already looks pretty good: 80% utilization during peak times with a 7 hour trough when utilization is below 50%. With Heracles, the worst case utilization is 80%, and the average is 90%. This is amazing.
Note that effective utilization can be greater than 100% since it's measured as throughput for the LC task on a single machine at 100% load plus throughput for the BE task on a single machine at 100% load. For example, if one task needs 100% of the DRAM bandwidth and 0% of the network bandwidth, and the other task needs the opposite, the two tasks would be able to co-locate on the same machine and achieve 200% effective utilization.
In the real world, we might “only” get 90% average utilization out of a system like Heracles. Recalling our operating cost estimate of $4 billion for a large company, if the company already had a quite-good average utilization of 75%, using a standard model for datacenter operating costs, we'd expect 15% more throughput per dollar, or $600 million in free compute. From talking to smaller companies that are on their way to becoming large (companies that spend in the range of $10 million to $100 million a year on compute), they often have utilization that's in the 20% range. Using the same total cost model again, they'd expect to get a 300% increase in compute per dollar, or $30 million to $300 million a year in free compute, depending on their size.
Other observations
All of the papers we've looked at have a lot of interesting gems. I'm not going to go into all of them here, but there are a few that jumped out at me.
ARM / Atom servers
It's been known for a long time that datacenter machines spend approximately half their time stalled, waiting on memory. In addition, the average number of instructions per clock that server chips are able to execute on real workloads is quite low.
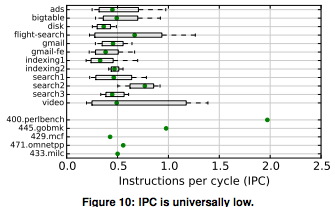
The top rows (with horizontal bars) are internal Google workloads and the bottom rows (with green dots) are workstation benchmarks from SPEC, a standard benchmark suite. We can see that Google workloads are lucky to average .5 instructions per clock. We also previously saw that these workloads cause cores to be stalled on memory at least half the time.
Despite spending most of their time waiting for memory and averaging something like half an instruction per clock cycle, high-end server chips do much better than Atom or ARM chips on real workloads (Reddi et al., ToCS 2011). This sounds a bit paradoxical -- if chips are just waiting on memory, why should you need a high-performance chip? A tiny ARM chip can wait just as effectively. In fact, it might even be better at waiting since having more cores waiting means it can use more bandwidth. But it turns out that servers also spend a lot of their time exploiting instruction-level parallelism, executing multiple instructions at the same time.
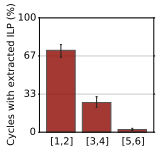
This is a graph of how many execution units are busy at the same time. Almost a third of the time is spent with 3+ execution units busy. In between long stalls waiting on memory, high-end chips are able to get more computation done and start waiting for the next stall earlier. Something else that's curious is that server workloads have much higher instruction cache miss rates than traditional workstation workloads.
Code and Data Prioritization Technology
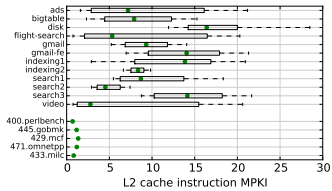
Once again, the top rows (with horizontal bars) are internal Google workloads and the bottom rows (with green dots) are workstation benchmarks from SPEC, a standard suite benchmark suite. The authors attribute this increase in instruction misses to two factors. First, that it's normal to deploy large binaries (100MB) that overwhelm instruction caches. And second, that instructions have to compete with much larger data streams for space in the cache, which causes a lot of instructions to get evicted.
In order to address this problem, Intel introduced what they call “Code and Data Prioritization Technology” (CDP). This is an extension of CAT that allows cores to separately limit which subsets of the LLC instructions and data can occupy. Since it's targeted at the last-level cache, it doesn't directly address the graph above, which shows L2 cache miss rates. However, the cost of an L2 cache miss that hits in the LLC is something like 26ns on Broadwell vs. 86ns for an L2 miss that also misses the LLC and has to go to main memory, which is a substantial difference.
Kanev et al. propose going a step further and having a split icache/dcache hierarchy. This isn't exactly a radical idea -- l1 caches are already split, so why not everything else? My guess is that Intel and other major chip vendors have simulation results showing that this doesn't improve performance per dollar, but who knows? Maybe we'll see split L2 caches soon.
SPEC
A more general observation is that SPEC is basically irrelevant as a benchmark now. It's somewhat dated as a workstation benchmark, and simply completely inappropriate as a benchmark for servers, office machines, gaming machines, dumb terminals, laptops, and mobile devices. The market for which SPEC is designed is getting smaller every year, and SPEC hasn't even been really representative of that market for at least a decade. And yet, among chip folks, it's still the most widely used benchmark around.
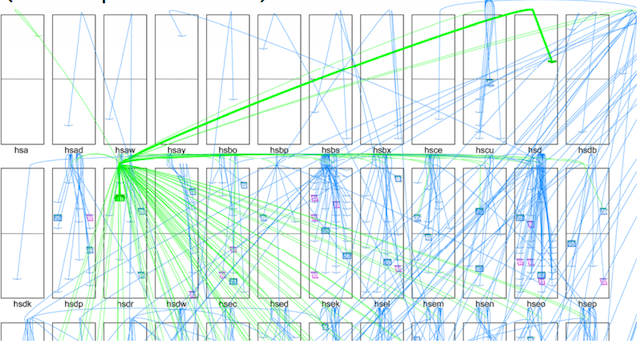
This is what a search query looks like at Google. A query comes in, a wide fanout set of RPCs are issued to a set of machines (the first row). Each of those machines also does a set of RPCs (the second row), those do more RPCs (the third row), and there's a fourth row that's not shown because the graph has so much going on that it looks like noise. This is one quite normal type of workload for a datacenter, and there's nothing in SPEC that looks like this.
There are a lot more fun tidbits in all of these papers, and I recommend reading them if you thought anything in this post was interesting. If you liked this post, you'll probably also like this talk by Dick Sites on various performance and profiling related topics, this post on Intel's new CLWB and PCOMMIT instructions, and this post on other "new" CPU features.
Thanks to Leah Hanson, David Kanter, Joe Wilder, Nico Erfurth, and Jason Davies for comments/corrections on this.