It's really common to see claims that some meme is backed by “studies” or “science”. But when I look at the actual studies, it usually turns out that the data are opposed to the claim. Here are the last few instances of this that I've run across.
Dunning-Kruger
A pop-sci version of Dunning-Kruger, the most common one I see cited, is that, the less someone knows about a subject, the more they think they know. Another pop-sci version is that people who know little about something overestimate their expertise because their lack of knowledge fools them into thinking that they know more than they do. The actual claim Dunning and Kruger make is much weaker than the first pop-sci claim and, IMO, the evidence is weaker than the second claim. The original paper isn't much longer than most of the incorrect pop-sci treatments of the paper, and we can get pretty good idea of the claims by looking at the four figures included in the paper. In the graphs below, “perceived ability” is a subjective self rating, and “actual ability” is the result of a test.
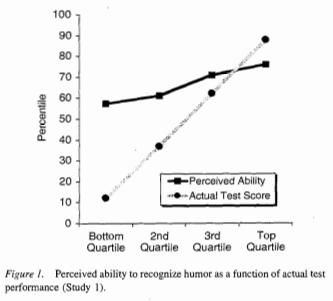
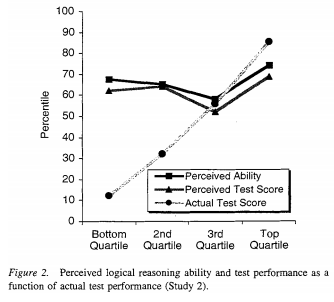
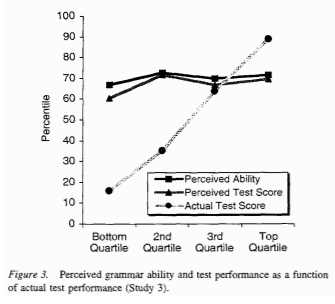
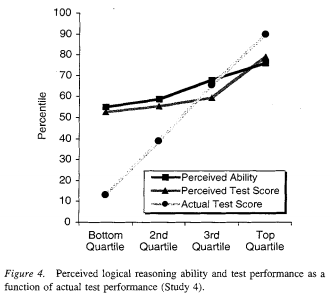
In two of the four cases, there's an obvious positive correlation between perceived skill and actual skill, which is the opposite of the first pop-sci conception of Dunning-Kruger that we discussed. As for the second, we can see that people at the top end also don't rate themselves correctly, so the explanation for Dunning-Kruger's results is that people who don't know much about a subject (an easy interpretation to have of the study, given its title, Unskilled and Unaware of It: How Difficulties in Recognizing One's Own Incompetence Lead to Inflated Self-Assessments) is insufficient because that doesn't explain why people at the top of the charts have what appears to be, at least under the conditions of the study, a symmetrically incorrect guess about their skill level. One could argue that there's a completely different effect that just happens to cause the same, roughly linear, slope in perceived ability that people who are "unskilled and unaware of it" have. But, if there's any plausible simpler explanation, then that explanation seems overly complicated without additional evidence (which, if any exists, is not provided in the paper).
A plausible explanation of why perceived skill is compressed, especially at the low end, is that few people want to rate themselves as below average or as the absolute best, shrinking the scale but keeping a roughly linear fit. The crossing point of the scales is above the median, indicating that people, on average, overestimate themselves, but that's not surprising given the population tested (more on this later). In the other two cases, the correlation is very close to zero. It could be that the effect is different for different tasks, or it could be just that the sample size is small and that the differences between the different tasks is noise. It could also be that the effect comes from the specific population sampled (students at Cornell, who are probably actually above average in many respects). If you look up Dunning-Kruger on Wikipedia, it claims that a replication of Dunning-Kruger on East Asians shows the opposite result (perceived skill is lower than actual skill, and the greater the skill, the greater the difference), and that the effect is possibly just an artifact of American culture, but the citation is actually a link to an editorial which mentions a meta analysis on East Asian confidence, so that might be another example of a false citation. Or maybe it's just a link to the wrong source. In any case, the effect certainly isn't that the more people know, the less they think they know.
Income & Happiness
It's become common knowledge that money doesn't make people happy. As of this writing, a Google search for happiness income returns a knowledge card that making more than $75k/year has no impact on happiness. Other top search results claim the happiness ceiling occurs at $10k/year, $30k/year, $40k/year and $75k/year.
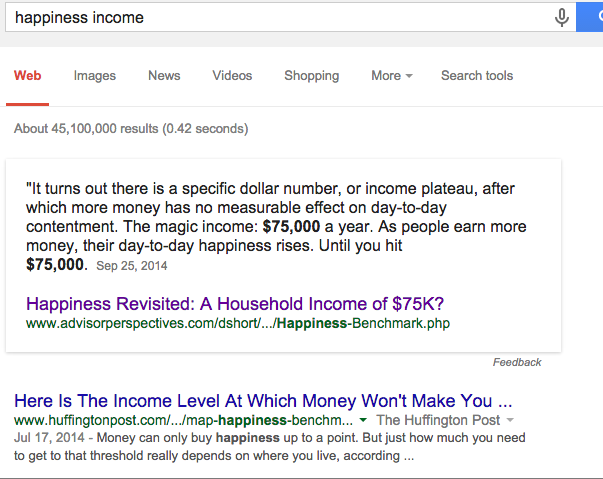
Not only is that wrong, the wrongness is robust across every country studied, too.
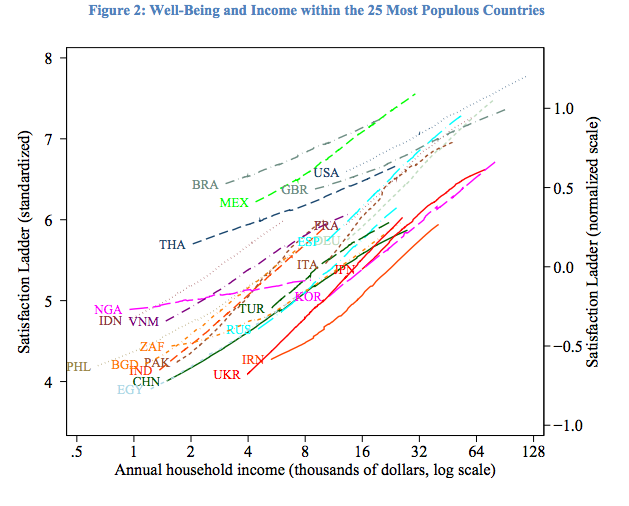
That happiness is correlated with income doesn't come from cherry picking one study. That result holds across five iterations of the World Values Survey (1981-1984, 1989-1993, 1994-1999, 2000-2004, and 2005-2009), three iterations of the Pew Global Attitudes Survey (2002, 2007, 2010), five iterations of the International Social Survey Program (1991, 1998, 2001, 2007, 2008), and a large scale Gallup survey.
The graph above has income on a log scale, if you pick a country and graph the results on a linear scale, you get something like this.
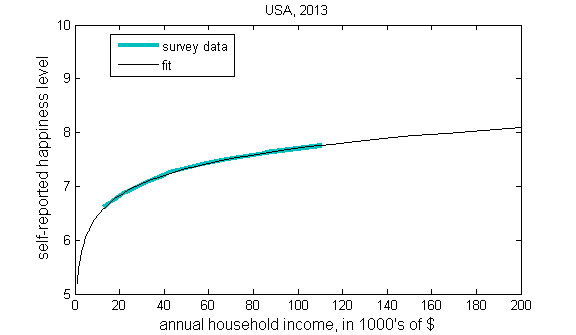
As with all graphs of a log function, it looks like the graph is about to level off, which results in interpretations like the following:
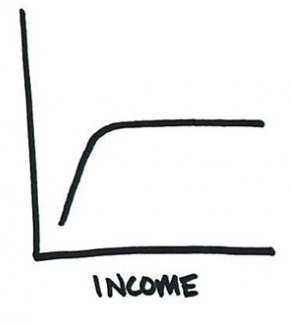
That's an actual graph from an article that claims that income doesn't make people happy. These vaguely log-like graphs that level off are really common. If you want to see more of these, try an image search for “happiness income”. My favorite is the one where people who make enough money literally hit the top of the scale. Apparently, there's a dollar value which not only makes you happy, it makes you as happy as it is possible for humans to be.
As with Dunning-Kruger, you can look at the graphs in the papers to see what's going on. It's a little easier to see why people would pass along the wrong story here, since it's easy to misinterpret the data when it's plotted against a linear scale, but it's still pretty easy to see what's going on by taking a peek at the actual studies.
Hedonic Adaptation & Happiness
The idea that people bounce back from setbacks (as well as positive events) and return to a fixed level of happiness entered the popular consciousness after Daniel Gilbert wrote about it in a popular book.
But even without looking at the literature on adaptation to adverse events, the previous section on wealth should cast some doubt on this. If people rebound from both bad events and good, how is it that making more money causes people to be happier?
Turns out, the idea that people adapt to negative events and return to their previous set-point is a myth. Although the exact effects vary depending on the bad event, disability, divorce, loss of a partner, and unemployment all have long-term negative effects on happiness. Unemployment is the one event that can be undone relatively easily, but the effects persist even after people become reemployed. I'm only citing four studies here, but a meta analysis of the literature shows that the results are robust across existing studies.
The same thing applies to positive events. While it's “common knowledge” that winning the lottery doesn't make people happier, it turns out that isn't true, either.
In both cases, early cross-sectional results indicated that it's plausible that extreme events, like winning the lottery or becoming disabled, don't have long term effects on happiness. But the longitudinal studies that follow individuals and measure the happiness of the same person over time as events happen show the opposite result -- events do, in fact, affect happiness. For the most part, these aren't new results (some of the initial results predate Daniel Gilbert's book), but the older results based on less rigorous studies continue to propagate faster than the corrections.
Chess position memorization
I frequently see citations claiming that, while experts can memorize chess positions better than non-experts, the advantage completely goes away when positions are randomized. When people refer to a specific citation, it's generally Chase and Simon's 1973 paper Perception in Chess, a "classic" which has been cited a whopping 7449 times in the literature, which says:
De Groat did, however, find an intriguing difference between masters and weaker players in his short-term memory experiments. Masters showed a remarkable ability to reconstruct a chess position almost perfectly after viewing it for only 5 sec. There was a sharp dropoff in this ability for players below the master level. This result could not be attributed to the masters’ generally superior memory ability, for when chess positions were constructed by placing the same numbers of pieces randomly on the board, the masters could then do no better in reconstructing them than weaker players, Hence, the masters appear to be constrained by the same severe short-term memory limits as everyone else ( Miller, 1956), and their superior performance with "meaningful" positions must lie in their ability to perceive structure in such positions and encode them in chunks. Specifically, if a chess master can remember the location of 20 or more pieces on the board, but has space for only about five chunks in short-term memory, then each chunk must be composed of four or five pieces, organized in a single relational structure.
The paper then runs an experiment which "proves" that master-level players actually do worse than beginners when memorizing random mid-game positions even though they do much better memorizing real mid-game positions (and, in end-game positions, they do the about the same as beginners when positions are randomized). Unfortunately, the paper used an absurdly small sample size of one chess player at each skill level.
A quick search indicates that this result does not reproduce with larger sample sizes, e.g., Gobet and Simon, in "Recall of rapidly presented random chess positions is a function of skill", say
A widely cited result asserts that experts’ superiority over novices in recalling meaningful material from their domain of expertise vanishes when they are confronted with random material. A review of recent chess experiments in which random positions served as control material (presentation time between 3 and 10 sec) shows, however, that strong players generally maintain some superiority over weak players even with random positions, although the relative difference between skill levels is much smaller than with game positions. The implications of this finding for expertise in chess are discussed and the question of the recall of random material in other domains is raised.
They find this scales with skill level and, e.g., for "real" positions, 2350+ ELO players memorized ~2.2x the number of correct pieces that 1600-2000 ELO players did, but the difference was ~1.6x for random positions (these ratios are from eyeballing a graph and may be a bit off). 1.6x is smaller than 2.2x, but it's certainly not the claimed 1.0.
I've also seen this result cited to claim that it applies to other fields, but in a quick search of applying this result to other fields, results either show something similar (a smaller but still observable difference on randomized positions) or don't reproduce, e.g., McKeithen did this for programmers and found that, on trying to memorize programs, on "normal" program experts were ~2.5x better than beginners on the first trial and 3x better by the 6th trial, whereas on the "scrambled" program, experts were 3x better on the first trial and progressed to being only ~1.5x better by the 6th trial. Despite this result contradicting Chase and Simon, I've seen people cite this result to claim the same thing as Chase and Simon, presumably from people who didn't read what McKeithen actually wrote.
Type Systems
Unfortunately, false claims about studies and evidence aren't limited to pop-sci memes; they're everywhere in both software and hardware development. For example, see this comment from a Scala/FP "thought leader":

I see something like this at least once a week. I'm picking this example not because it's particularly egregious, but because it's typical. If you follow a few of the big time FP proponents on twitter, you'll see regularly claims that there's very strong empirical evidence and extensive studies backing up the effectiveness of type systems.
However, a review of the empirical evidence shows that the evidence is mostly incomplete, and that it's equivocal where it's not incomplete. Of all the false memes, I find this one to be the hardest to understand. In the other cases, I can see a plausible mechanism by which results could be misinterpreted. “Relationship is weaker than expected” can turn into “relationship is opposite of expected”, log can look a lot like an asymptotic function, and preliminary results using inferior methods can spread faster than better conducted follow-up studies. But I'm not sure what the connection between the evidence and beliefs are in this case.
Is this preventable?
I can see why false memes might spread quickly, even when they directly contradict reliable sources. Reading papers sounds like a lot of work. It sometimes is. But it's often not. Reading a pure math paper is usually a lot of work. Reading an empirical paper to determine if the methodology is sound can be a lot of work. For example, biostatistics and econometrics papers tend to apply completely different methods, and it's a lot of work to get familiar enough with the set of methods used in any particular field to understand precisely when they're applicable and what holes they have. But reading empirical papers just to see what claims they make is usually pretty easy.
If you read the abstract and conclusion, and then skim the paper for interesting bits (graphs, tables, telling flaws in the methodology, etc.), that's enough to see if popular claims about the paper are true in most cases. In my ideal world, you could get that out of just reading the abstract, but it's not uncommon for papers to make claims in the abstract that are much stronger than the claims made in the body of the paper, so you need to at least skim the paper.
Maybe I'm being naive here, but I think a major reason behind false memes is that checking sources sounds much harder and more intimidating than it actually is. A striking example of this is when Quartz published its article on how there isn't a gender gap in tech salaries, which cited multiple sources that showed the exact opposite. Twitter was abuzz with people proclaiming that the gender gap has disappeared. When I published a post which did nothing but quote the actual cited studies, many of the same people then proclaimed that their original proclamation was mistaken. It's great that they were willing to tweet a correction, but as far as I can tell no one actually went and read the source data, even though the graphs and tables make it immediately obvious that the author of the original Quartz article was pushing an agenda, not even with cherry picked citations, but citations that showed the opposite of their thesis.
Unfortunately, it's in the best interests of non-altruistic people who do read studies to make it seem like reading studies is difficult. For example, when I talked to the founder of a widely used pay-walled site that reviews evidence on supplements and nutrition, he claimed that it was ridiculous to think that "normal people" could interpret studies correctly and that experts are needed to read and summarize studies for the masses. But he's just a serial entrepreneur who realized that you can make a lot of money by reading studies and summarizing the results! A more general example is how people sometimes try to maintain an authoritative air by saying that you need certain credentials or markers of prestige to really read or interpret studies.
There are certainly fields where you need some background to properly interpret a study, but even then, the amount of knowledge that a degree contains is quite small and can be picked up by anyone. For example, excluding lab work (none of which contained critical knowledge for interpreting results), I was within a small constact factor of spending one hour of time per credit hour in school. At the conversion rate, an engineering degree from my alma mater costs a bit more than 100 hours and almost all non-engineering degrees land at less than 40 hours, with a large amount of overlap between them because a lot of degrees will require the same classes (e.g., calculus). Gatekeeping reading and interpreting a study on whether or not someone has a credential like a degree is absurd when someone can spend a week's worth of time gaining the knowledge that a degree offers.
If you liked this post, you'll probably enjoy this post on odd discontinuities, this post how the effect of markets on discrimination is more nuanced than it's usually made out to be and this other post discussing some common misconceptions.
2021 update
In retrospect, I think the mystery of the "type systems" example is simple: it's a different kind of fake citation than the others. In the first three examples, a clever, contrarian, but actually wrong idea got passed around. This makes sense because people love clever, contrarian, ideas and don't care very much if they're wrong, so clever, contarian, relatively frequently become viral relative to their correctness.
For the type systems example, it's just that people commonly fabricate evidence and then appeal to authority to support their position. In the post, I was confused because I couldn't see how anyone could look at the evidence and then make the claims that type system advocates do but, after reading thousands of discussions from people advocating for their pet tool/language/practice, I can see that it was naive of me to think that these advocates would even consider looking for evidence as opposed to just pretending that evidence exists without ever having looked.
Thanks to Leah Hanson, Lindsey Kuper, Jay Weisskopf, Joe Wilder, Scott Feeney, Noah Ennis, Myk Pono, Heath Borders, Nate Clark, and Mateusz Konieczny for comments/corrections/discussion.
BTW, if you're going to send me a note to tell me that I'm obviously wrong, please make sure that I'm actually wrong. In general, I get great feedback and I've learned a lot from the feedback that I've gotten, but the feedback I've gotten on this post has been unusually poor. Many people have suggested that the studies I've referenced have been debunked by some other study I clearly haven't read, but in every case so far, I've already read the other study.